


U.S. Hotel Performance Q2 2025
- Posted by admin
- On September 2, 2025
- 0 Comments

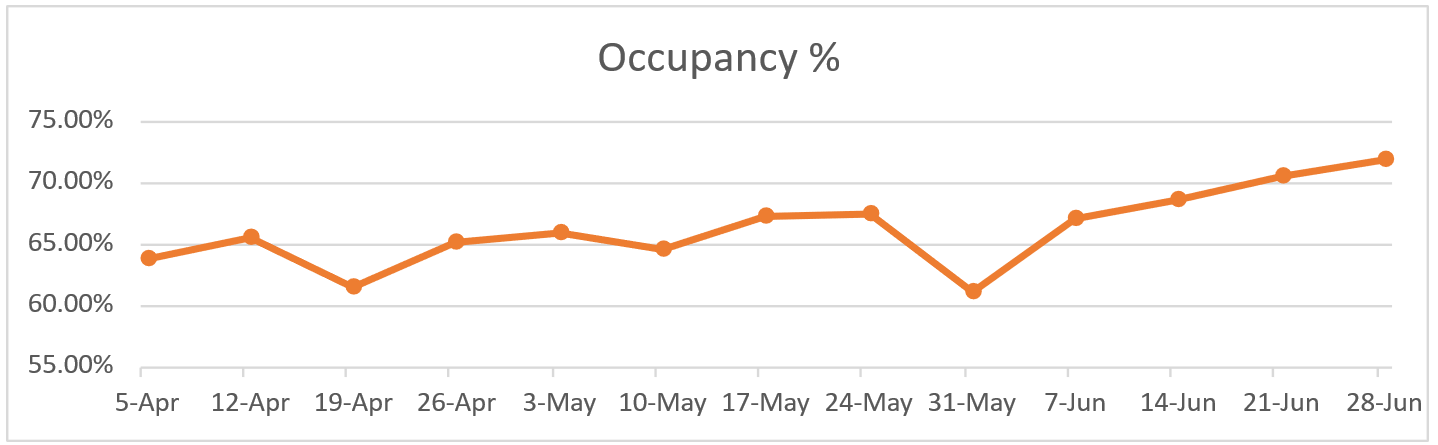
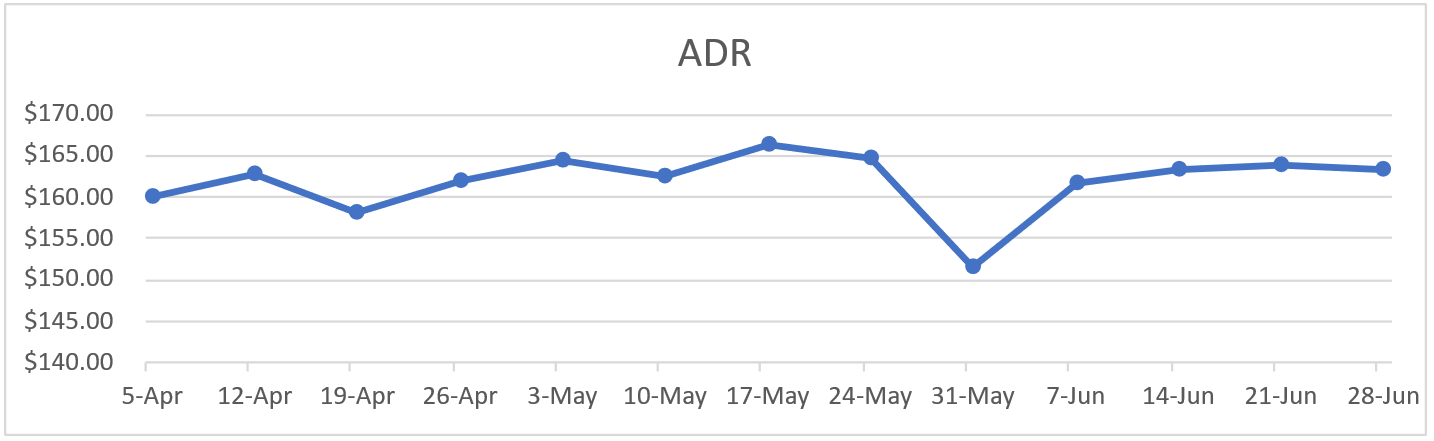
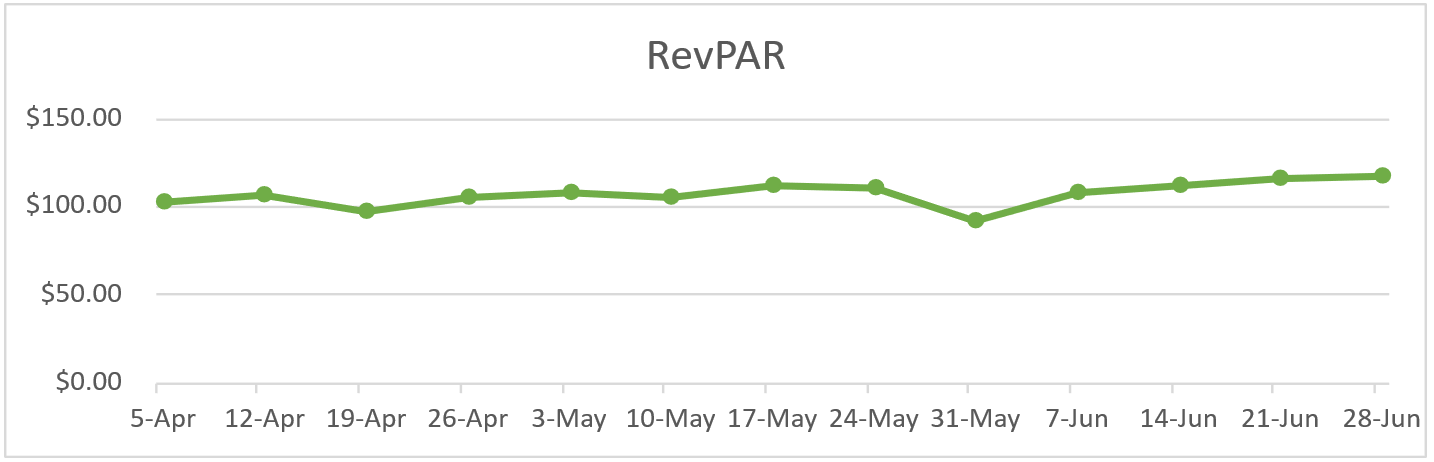
U.S. hotel performance in Q2 2025 was marked by fluctuations around key holiday periods. Occupancy declined during the Easter and Passover travel weeks, as families prioritized shorter trips, and many urban markets experienced a reduction in business travel. Another notable soft spot emerged around Memorial Day, when operators heavily discounted to stimulate bookings, briefly pushing the ADR near $150. From early June onwards, both occupancy and ADR strengthened, ending the quarter above 70% occupancy with rates stabilizing near $165. This finish signals resilient summer demand and improving group activity, even as holiday-driven dips highlighted lingering consumer caution.
Occupancy was reported at 63.80% at the start of Q2 2025, increasing to 71.90% by the end of Q2 2025. ADR was $160.18 at the beginning of Q2 2025, increasing to $163.30 by the end of Q2 2025. RevPAR was $102.21 at the start of Q2 2025, increasing to $117.45 by the end of Q2 2025.
(Source: STR)
Analytical Summary
Major Q2 2025 transactions (By Sale Price)
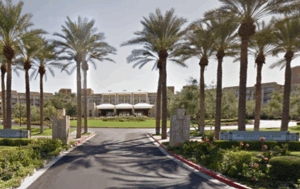
| 1. Hotel Name: JW Marriott Phoenix Desert Ridge Resort & Spa
Location: Phoenix, AZ No. of rooms: 950 Sale Price: $755,000,000 Price per unit: $794,737 per unit Seller: Elliot Management Corp. Buyer: Ryman Hospitality Properties |
 |
| 2. Hotel Name: Kimpton Hotel Eventi
Location: New York, NY No. of rooms: 292 Sale Price: $174,500,000 Price per unit: 597,603 per unit Seller: DLJ Real Estate Capital Buyer: BRE Hotels & Resorts LLC |
 |
| 3. Hotel Name: Viewline Resort Snowmass, Autograph
Location: Snowmass Village, CO No. of rooms: 254 Sale Price: $144,000,000 Price per unit: $566,929 per unit Seller: High Street Real Estate Buyer: Elevated Returns |
 |
| 4. Hotel Name: Fairmont Dallas
Location: Dallas, TX No. of rooms: 545 Sale Price: $111,000,000 Price per unit: $203,670 per unit Seller: Xenia Hotels & Resorts, Inc. Buyer: Sixth Street Partners, LLC |
 |
Source: CoStar
Q2 2025 Cap Rates
Average cap rates for U.S. hotels increased by 1 basis point in Q2 2025 as compared to Q1 2025. The following table illustrates minimum, maximum, and average cap rates for U.S. hotels in Q2 2025 & Q1 2025.
(Source: RealtyRates.com)
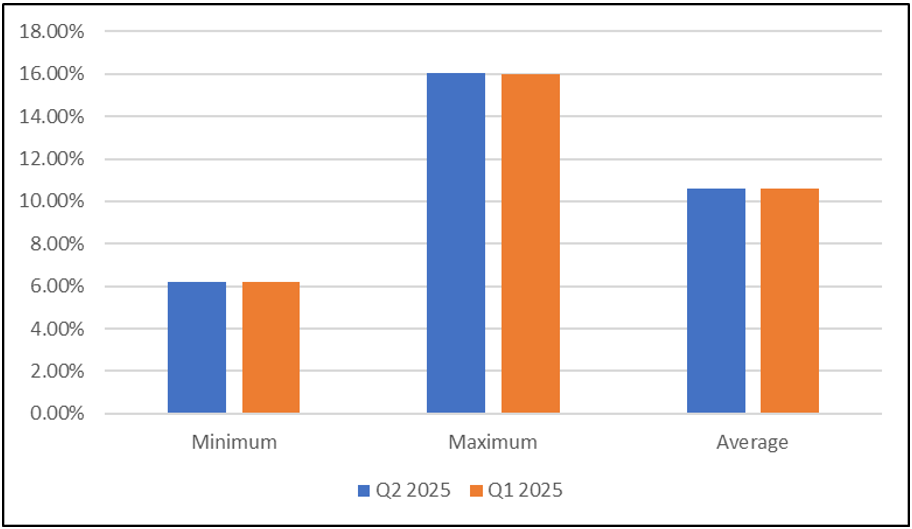
| Cap Rate | Q2 2025 | Q1 2024 | Difference (bps) |
| Minimum | 6.18% | 6.18% | 0 |
| Maximum | 16.06% | 16.01% | 5 |
| Average | 10.62% | 10.61% | 1 |
Source: RealtyRates.com
Outlook
The U.S. hotel industry is entering Q3 2025 on a cautiously positive note. High-end hotels continue to see strong demand from affluent travelers and corporate guests, while midscale and economy properties are still under pressure from softer consumer spending and fewer international visitors. Booking windows remain short, reflecting traveler caution, though group and event business is helping support occupancy in major urban centers.
On the investment side, hotel REITs and listed operators are dealing with tighter margins and modest RevPAR growth. Even so, well-located luxury and resort properties are holding value and remain attractive to investors. Cap rates are steady, but capital is moving toward quality assets in top markets, with experiential properties drawing the most attention. Overall, Q3 should deliver robust operational gains but with an uneven impact across segments—favoring those positioned at the higher end of the market.


0 Comments