


U.S. Office Market Performance Q3 2025
- Posted by admin
- On February 2, 2026
- 0 Comments

- Accelerating Momentum in Office Net Absorption: Net absorption hit 16 million square feet (msf) in the latest quarter, the sixth consecutive period of growth and the highest since late 2021. Prime assets have seen consistent positive absorption since early 2020, unlike non-prime buildings.
- Steady Gains in Leasing Activity: Leasing momentum continued to strengthen, with quarterly activity rising 15% and y-o-y volume increasing 11% to reach 59.8 msf, pushing year-to-date totals up 4%. Smaller tenants remained the primary drivers of activity, with leases between 10,000 and 20,000 sf making up 56% of all transactions, up from 47% pre-pandemic.
- Vacancy Rates: The national vacancy rate stood at 18.8% in Q3 2025. Prime office vacancy dropped to 14.2% in Q3, falling 50-bps, while non-prime vacancy edged down to 19.1% after a 20-bps decline. The gap between the two continued to widen as tenants increasingly prioritized higher-quality, better-located buildings.
- Narrowing Gap Between Asking and Achieved Rents: Average asking rents rose 1.3% y-o-y to $36.40 per sf, slightly above early-2020 levels but below inflation-adjusted values. The gap between listed and negotiated rents narrowed to 10.8% as landlords regained some bargaining power, though it remains wider than pre-2020. Effective rent growth remained muted in Q3 due to generous concessions, especially in Class B and C properties.
- Shrinking Office Construction Pipeline: Office space under development fell to 16.4 msf in Q3, less than 0.5% of U.S. inventory and down 87% from early 2020. Completions are expected to total approximately 13 msf in 2025, the lowest annual figure since 2012 and well below the 41.1 msf long-term average.
- Leasing Momentum Strengthens in Gateway Markets: Gateway cities increased their share of national leasing to 56%, with Manhattan leading at 14.6%. Activity also rose in several large markets, including San Francisco and Philadelphia, while Texas and Sun Belt cities such as Houston, Dallas, Austin, Phoenix, and Atlanta saw y-o-y declines.
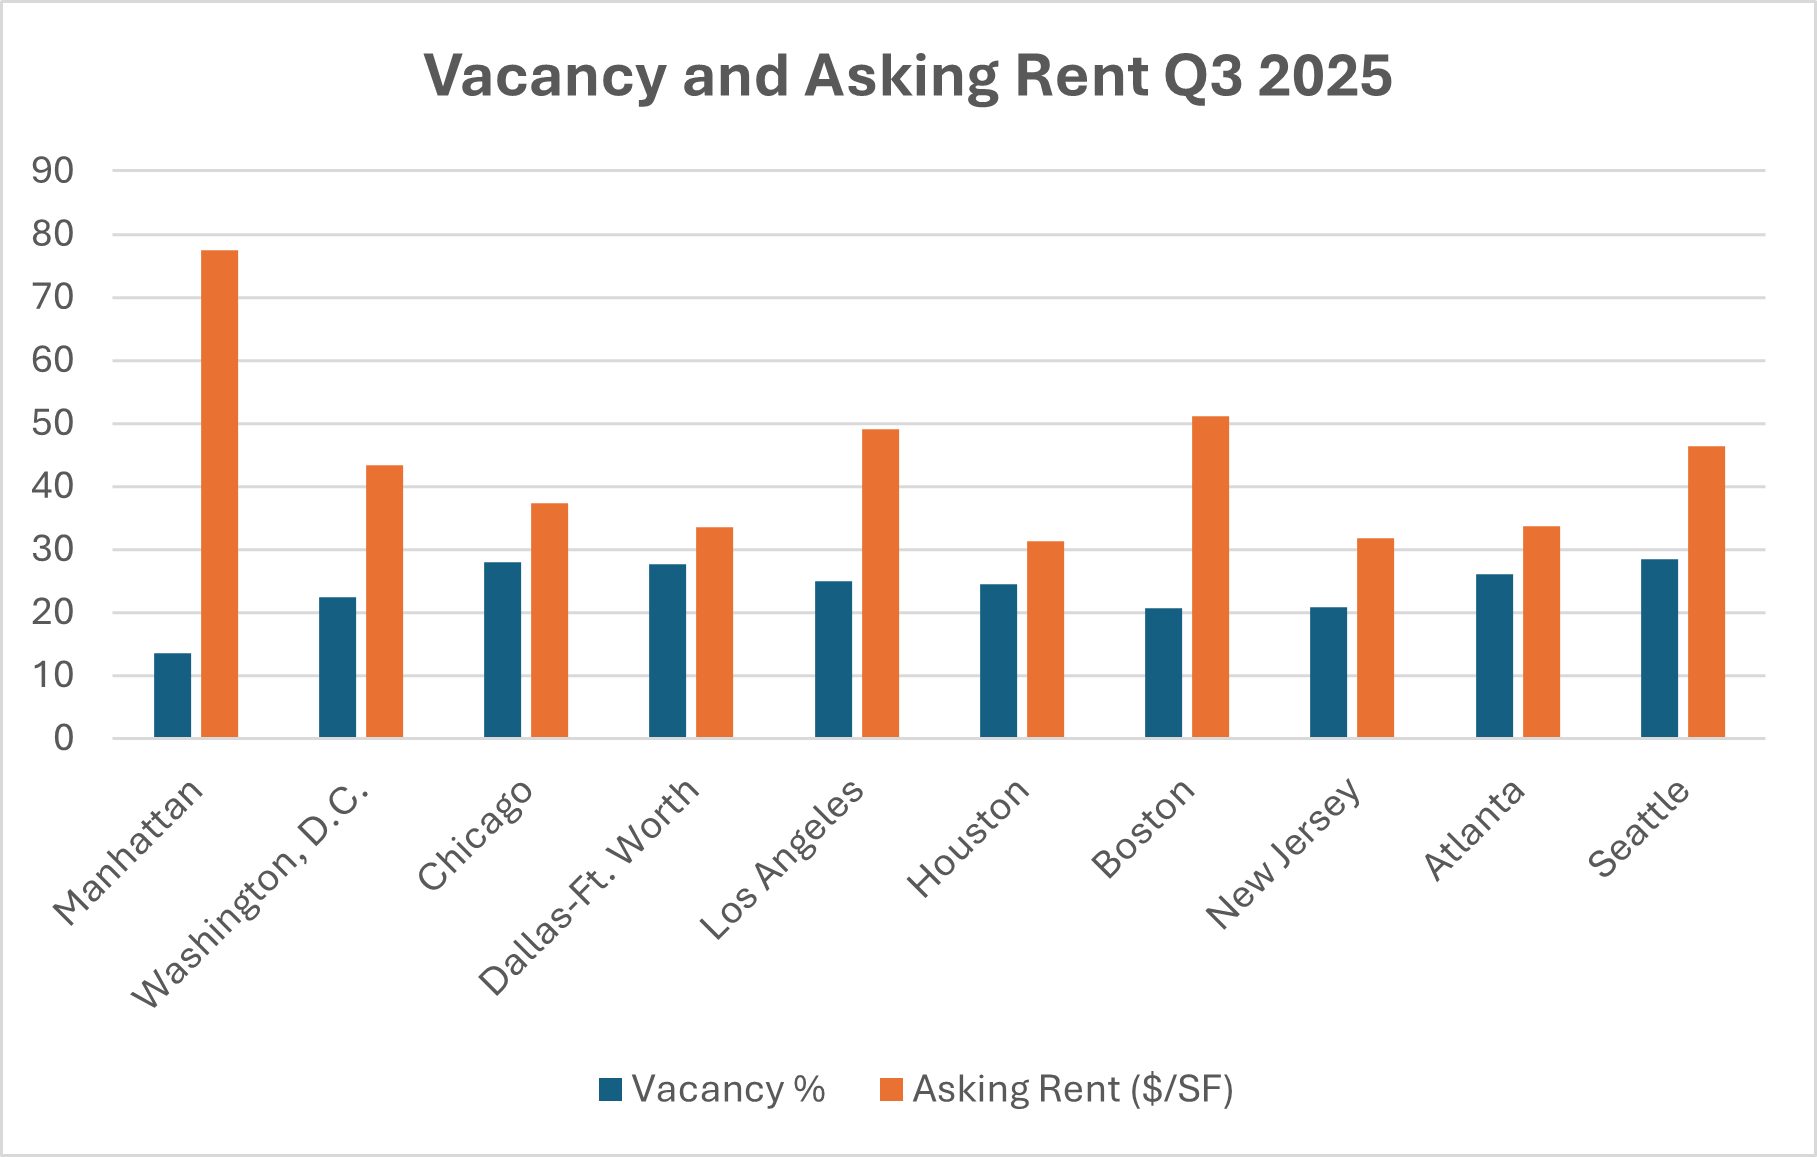
The following chart compares Vacancy % and Asking Rent ($/SF) across several major U.S. metropolitan areas.


0 Comments