


U.S. Industrial Market Performance Q3 2025
- Posted by admin
- On January 13, 2026
- 0 Comments

- E-commerce drives industrial demand: The online share of non-automotive retail sales increased for a third consecutive quarter to 23.5%, supported by higher spending on groceries, health and wellness, and household goods. While growth has eased from pandemic peaks, e-commerce continues to underpin warehouse demand, with retailers and 3PLs favoring locations near major population centers.
- Absorption improves, vacancy stabilizes: Net absorption rebounded to 53.3 million sq. ft. (msf) in Q3, supported by several large build-to-suit deliveries. Vacancy remained stable at 6.6% despite continued new supply, reflecting sustained tenant activity. The supply-demand gap narrowed during Q3, pointing to improving market balance toward year-end.
- Mid-sized spaces drive leasing: Year-to-date leasing rose 9.8% y-o-y to 682 msf, as occupiers focused on network efficiency and flexibility. Facilities sized 100,000-300,000 sq. ft. recorded the strongest growth, with leasing activity up 20.9% y-o-y. Leasing for properties above 700,000 sq. ft. remained subdued, as large users delayed major commitments and prioritized existing space. 1,000,000+ sq. ft. leases declined to 27 years to date.
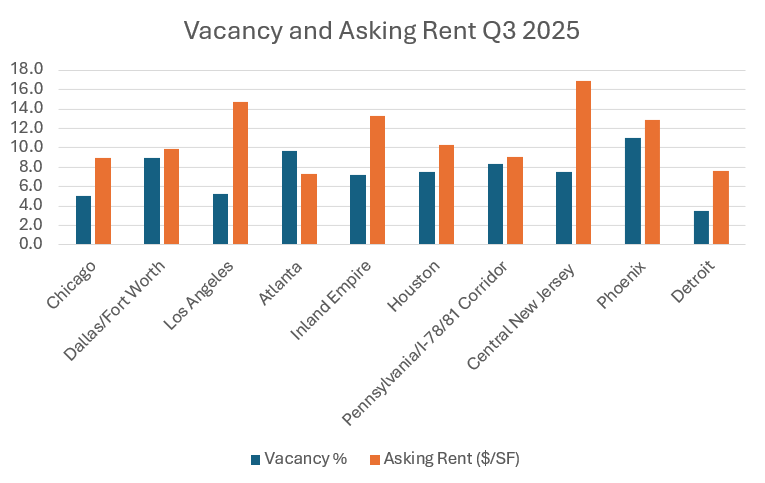
- Asking rents continue to ease: Average asking rents declined 1.3% q-o-q and 3.4% y-o-y to $10.75 per sq. ft., marking the sixth straight quarterly decrease. Elevated speculative supply in select markets is expected to limit near-term rent growth, with conditions stabilizing as construction slows and space is absorbed.
- Construction eases, preleasing remains elevated: Industrial space under construction declined to 226.9 msf, falling below 230 msf for the first time since 2017. Preleasing dipped slightly to 34.4% but stayed above the post-pandemic average of 32.6%. Available space under construction remained limited at 0.7% of total inventory, helping support vacancy stability into 2026.
- Construction starts slow: Q3 construction starts declined to 42.9 msf, reflecting a more cautious development environment. New projects were largely tied to secured tenants and prime locations, with limited speculative activity due to tighter financing and more normalized leasing demand.
The following chart compares Vacancy % and Asking Rent ($/SF) across several major U.S. metropolitan areas.


0 Comments