


U.S. Industrial Market Performance Q2 2025
- Posted by admin
- On October 15, 2025
- 0 Comments

The U.S. industrial real estate sector is undergoing a critical transition as it balances historic levels of supply with shifting patterns of tenant demand. In Q2 2025, the national vacancy rate reached 6.6%—its highest point in over a decade—reflecting a market recalibrating after years of rapid expansion. While this increase signals a cooling trend, it also underscores the sector’s resilience, as leasing activity still climbed nearly 9% year-over-year, led by mid-sized facilities that continue to attract occupiers adapting their logistics and manufacturing strategies.
E-commerce remains a cornerstone of demand, with online sales capturing a record 23.2% share of total retail. This sustained growth continues to drive warehouse and distribution requirements nationwide. At the same time, third-party logistics providers and manufacturers are emerging as leading occupiers, reshaping space utilization as supply chains regionalize and nearshoring strategies gain momentum.
Despite five consecutive quarters of modest rent declines, averaging $10.88 per square foot, the market shows signs of stabilization. With construction pipelines tapering to their lowest levels since 2017 and 37% of new developments already preleased, future vacancy risks may be cushioned. Leading metros such as Dallas/Fort Worth, Phoenix, and Savannah are setting benchmarks in absorption and growth, while Houston continues to dominate new construction.
Looking ahead, stronger consumer confidence and a healthier labor market provide a supportive backdrop for recovery. As the industrial sector navigates softer rent pressures and an evolving tenant mix, stakeholders should remain focused on markets that demonstrate both resilience and long-term growth potential.
- Vacancy at a decade high: The national industrial vacancy rate climbed to 6.6%, the highest level since 2014, as new supply continued to outpace demand.
- Leasing momentum, but smaller deals: Leasing activity grew by nearly 9% year-over-year, mainly in mid-sized facilities (300K–700K sq. ft.). However, very large occupiers slowed down, with fewer mega-leases signed compared to last year.
- E-Commerce still expanding: Online sales hit a record 23.2% share of total retail, reinforcing long-term demand for warehouse and distribution space.
- 3PLs & manufacturers drive demand: Third-party logistics firms accounted for the largest share of big-box leasing, while manufacturers boosted activity significantly as supply chains shifted closer to home.
- Rent pressures emerge: Average asking rents slipped for the fifth straight quarter to $10.88 per sq. ft., reflecting softening conditions despite rent growth in several individual markets.
- Construction pipeline eases: Space under construction dropped to its lowest since 2017, though 37% is already preleased, providing some stability against future vacancy increases.
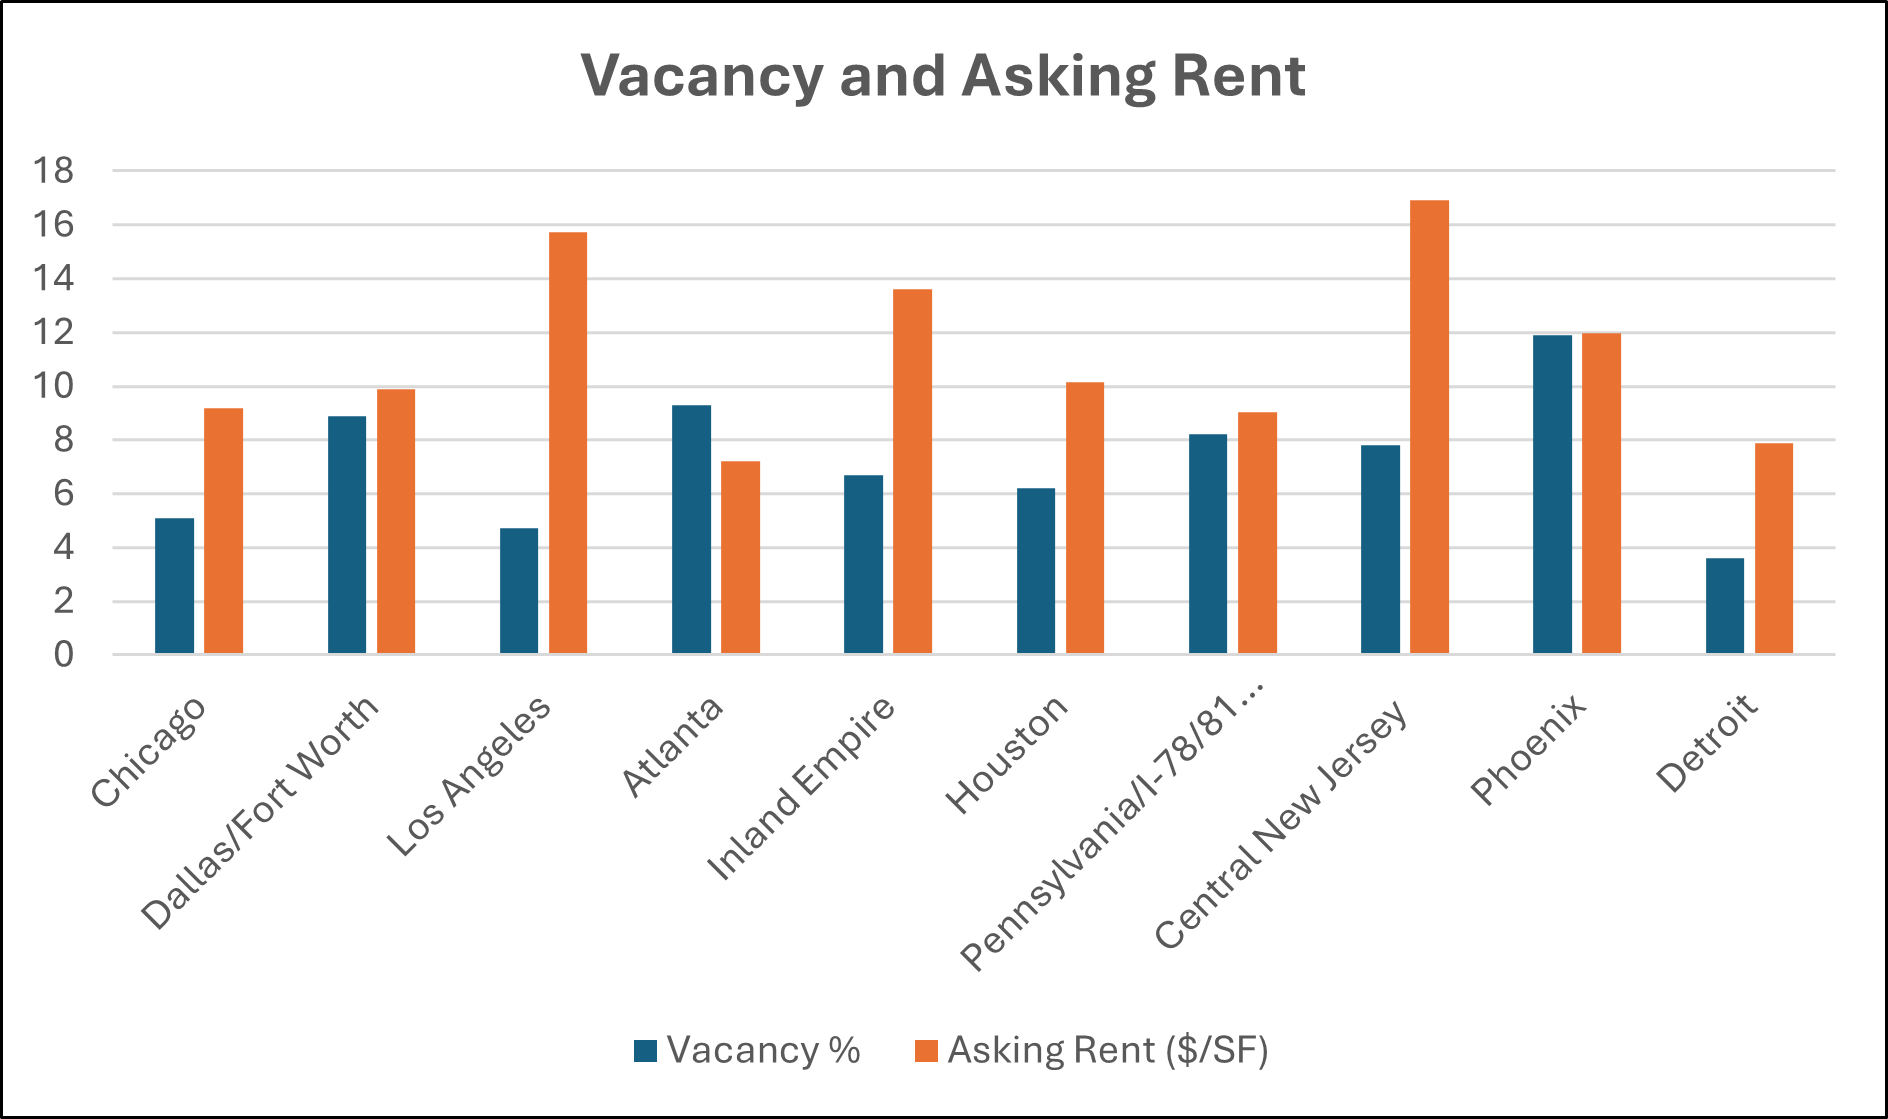
- Market leaders stand out: Dallas/Fort Worth and Phoenix led in space absorption, while Savannah posted the fastest growth relative to its inventory. Houston remained the most active construction market.
- Economic backdrop supports recovery: Improved consumer confidence and a slight dip in unemployment offer a more supportive environment for industrial demand heading into 2026.
The following chart compares Vacancy % and Asking Rent ($/SF) across several major U.S. metropolitan areas.


0 Comments